
Become a data-informed product manager
Data fundamentals for product managers

Hey, I’m Colin! I help PMs and business leaders improve their technical skills through real-world case studies. For more, check out my Live cohort course and subscribe on Substack.
Data is everywhere. As a PM, it’s critical that you’re fluent enough to answer questions and understand user behavior.
In this article, we’ll review the three main categories of data generated by most businesses and how to use them:
Operations and analytics data
Event data
3rd party data
Operational and analytical data
What are operational and analytical data?
Operations data comes directly from your product. Whenever a user opens a cart, reserves a hotel, or schedules a post, they create a record in your production database. Production databases are typically optimized for both reading data and writing data, as they are the primary source for every interaction in our product.

Operational databases refer to both the types of databases and how the data is stored. Most production products use relational databases, or SQL. This relies on a series of tables that are joined together with primary and foreign keys.

These databases support all types of operations - creating, reading, updating, and deleting records. Production relational databases include products like PostgreSQL, MySQL, SQLServer, and Oracle databases.
Analytics data reformats operations data to make it easier to run massive queries. Typically, data is only inserted to analytics databases through pipelines as a result of a change in an operations database. Data teams may also retain all data in an analytics database, even if it's deleted from an operational database.

Analytics data products include Databricks, Snowflake, BigQuery, and RedShift. They typically store massive amounts of data from many internal sources, allowing you to join across multiple business lines or domains.
These products focus more heavily on read speed than write, as the primary operation performed is running queries. Some products even separate compute and storage to allow you to spend more money for better performance.
What are some common patterns with operational and analytical data?
Operations databases store data based on the needs of your product’s users. This typically means that it’s more challenging to understand the data model and self serve as a product manager.
Analytics databases modify the schema of the original data to make analytics easier through derived tables. These tables may combine data from multiple initial tables in your operational database to simplify queries and improve performance. A common data model for this is the Star data model, using dimensions and facts.
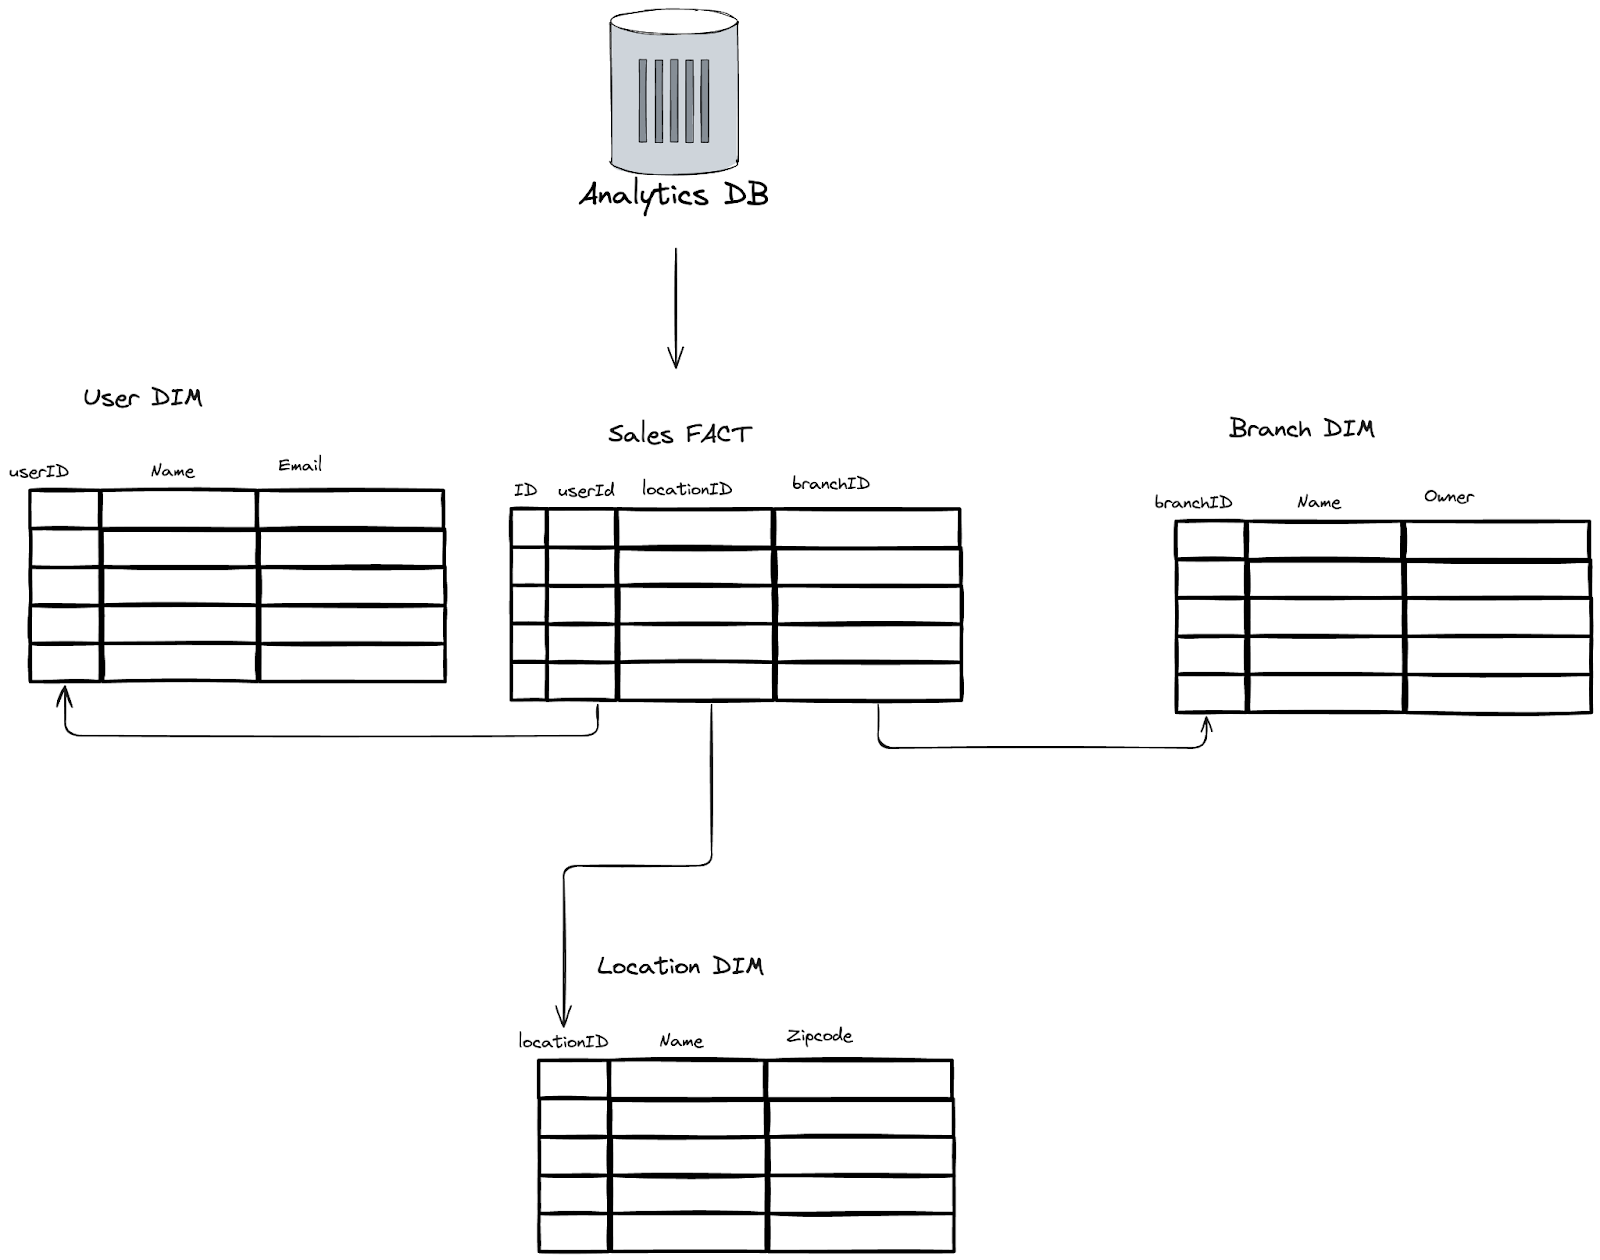
Data modeled in a Star schema requires fewer joins, is faster to read, and has less maintenance.
Another common but complex analytics data model is an OLAP cube. Where Star schemas require us to compute aggregations on the fly (How many sales did we have at branch 125 by user 2?), OLAP cubes pre-compute these calculations and store them. This makes querying aggregations much faster, but has less flexibility as new data is introduced to the data model. OLAP cubes also take up more storage and are much slower to add new data.

How can I practice?
The most important skill for PMs to navigate operational and analytical data is SQL.
SQL can be broken down into a few components:
Ability to read a data model and understand relationships
Ability to write queries
Ability to create new data models
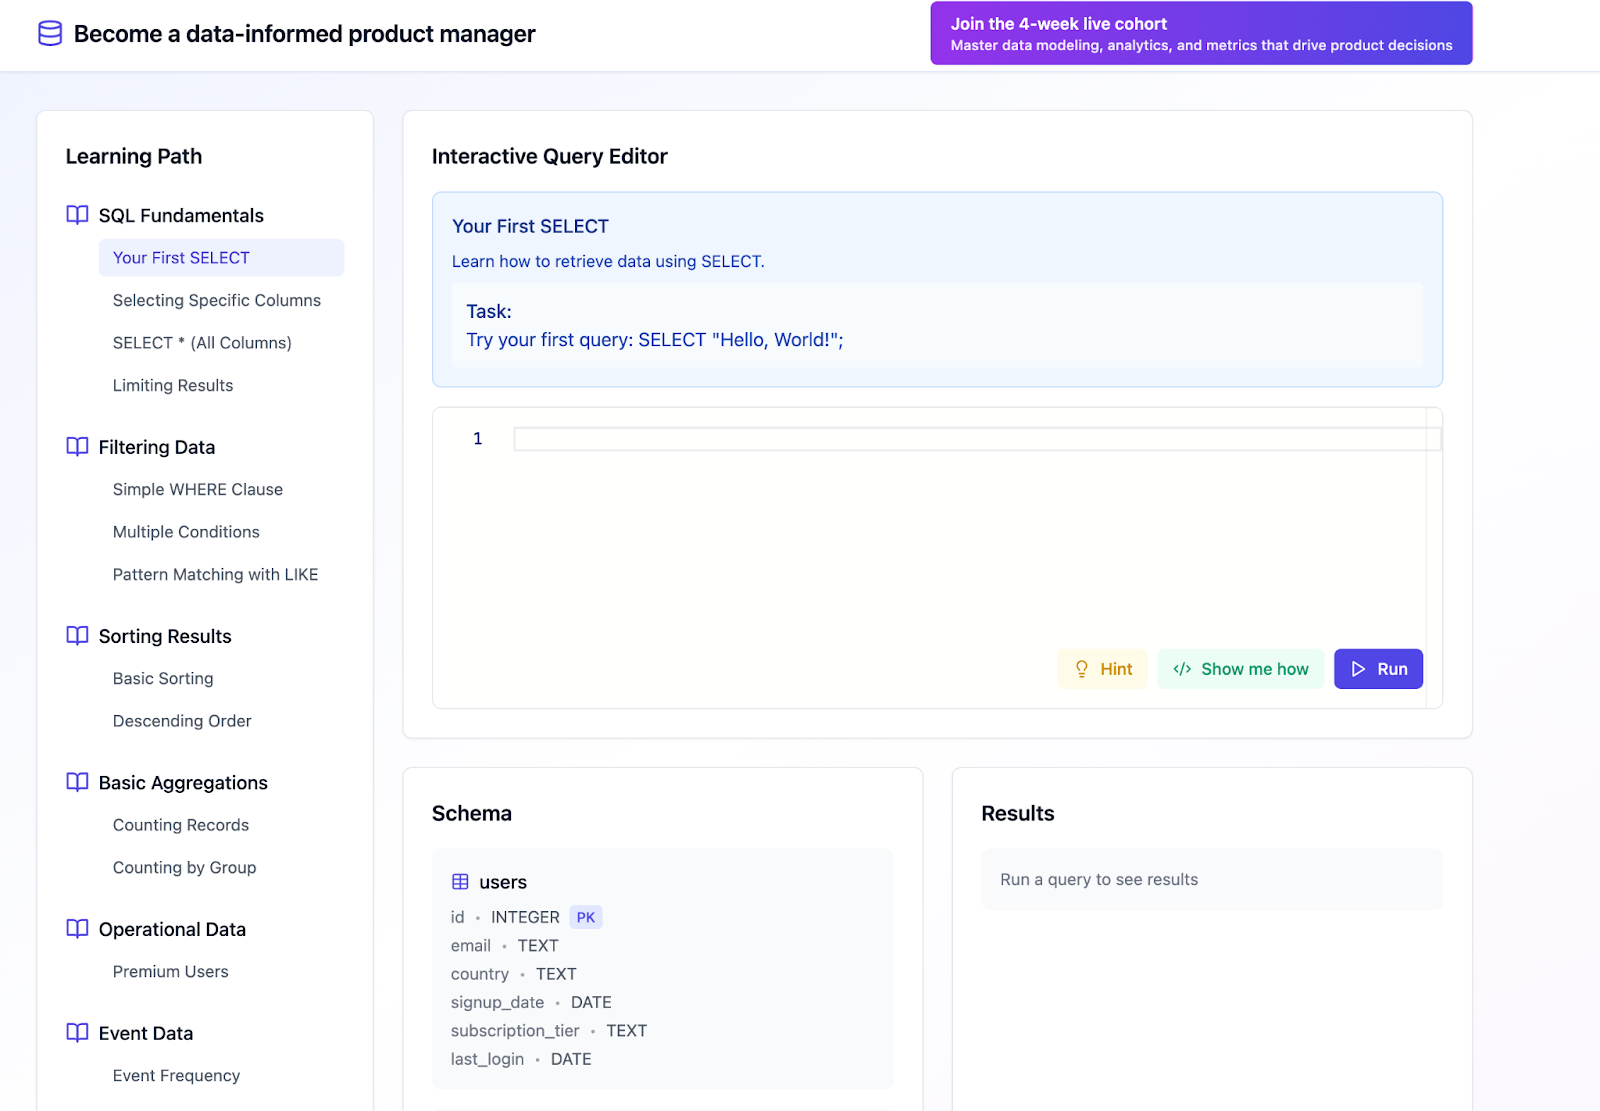
For a PM, understanding your data model and writing queries are the most valuable skills. To help with this, I’ve put together a few practice exercises for you to get started.
Check them out here
Event data
What is event data?
Event data is collected from user interactions with your product. Whenever a user clicks a button, completes a form, or navigates to a new page, an event is captured. These events share standard properties and custom properties.

Standard properties include data elements like the browser used, time, and the unique identifier for the user. Custom properties can be anything that makes sense in the event context, such as the name and id of an article viewed.
These events are typically collected by installing a 3rd party analytics tool. Common products include Amplutide, PostHog, Mixpanel, and Adobe Analytics.
All events are joined together to the user through a unique id, typically their email. This allows you to see a longitudinal record of every event performed by a user.

What are some common patterns with event data?
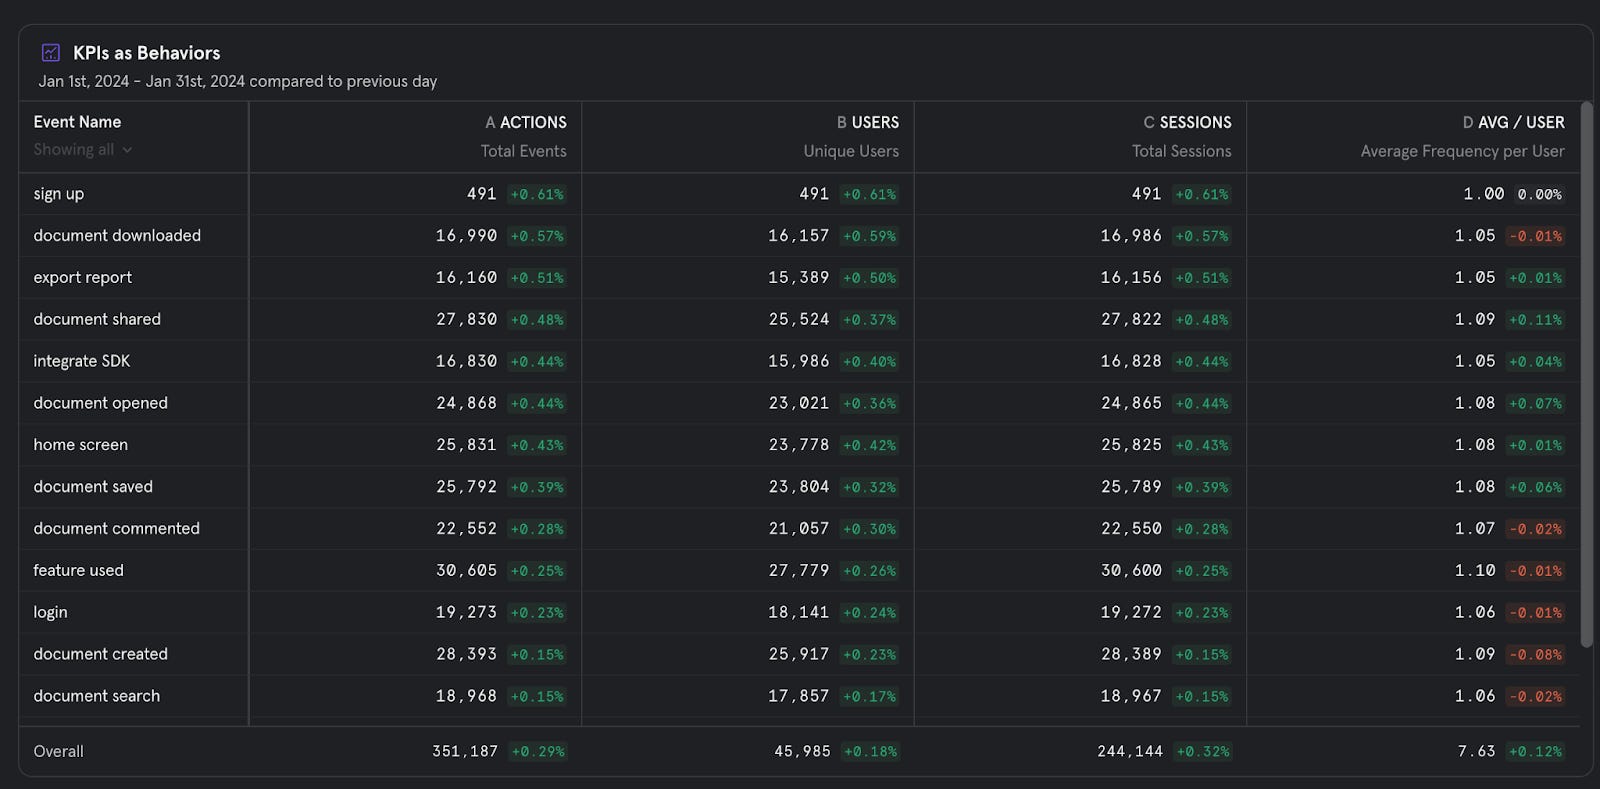
Event data is used to measure key product metrics like Weekly and Monthly Active Users, cohort retention, and key feature usage.
Event data is typically easier to navigate as its sole purpose is analytics. It does not need to support operations of the product for your users.
Analytics products also make event data easier to navigate. Rather than learning SQL, you can interact with a tool designed to help you answer the questions you need, like the Mixpanel query editor below.
On the other hand, event data can be extremely messy if your team does not take the time to implement it correctly. Event autocapture often creates a flood of incoming data that can be difficult to decipher. I recommend planning your approach to event data capture thoroughly by thinking through what questions you want to answer and what events are needed to support them.
How can I practice?
Sign up for a free Mixpanel account.
Navigate to the top right corner of and open a sample dataset (I recommend B2B SaaS)

Select Reports → Insights

Try to answer the following questions from the sample data:
What are the top 3 features used by customers?
How has company MRR by plan changed over the past 3 months?
3rd party data
3rd party data refers to data that exists outside of your product but is still important to your business. Examples include your CRM (Hubspot, Salesforce), your accounting software (Xero, NetSuite), your payment software (Stripe, Square), your email provider (Customer.io, MailGun), and more.
In the past few years, it’s become increasingly common to pipe data from SaaS products used by your company into a central warehouse (Customer Data Warehouse), or reverse this by pushing data from your warehouse into SaaS products. By combining data across tools, we can get a more fulsome view of our customers and their behavior.
What are data pipelines?
Data pipelines are the engine that pulls data from one product, reformats it as needed, and pushes it into another product.
For example, let’s say your startup has typically worked with small businesses, but the sales team is executing a sales strategy to go after large enterprise clients.
In Salesforce, we have data on the current deal size, our contacts, and our past conversations. Over in NetSuite, we have details on the customer’s typical payment cycle and our actual realized revenue. Finally, in Intercom, we have all of their customer support requests and resolutions.

Using data pipelines, we could combine data from each of these sources into a single data warehouse. Then, we could ask questions like “How does contract size relate to the number of support requests we receive?” to see if we’re scaling well, or if we’ll need to onboard more support to support our sales strategy. We can use this data to inform our financial models and ensure we’re aligned internally on expected margins.
You can use pre-built integrations from products like FiveTran and AirByte to handle moving data from cloud products to your warehouse (or vice versa).
Data pipelines are also used internally to move data from multiple internal sources to a centralized data warehouse.

Common tools for building and managing pipelines include DBT and Airflow, which run on distributed computing platforms like Apache Spark and Hadoop.
What is ETL / ELT?
ETL and ELT are very similar processes that describe how we can move data using data pipelines.
ETL refers to:
Extract
Transform
Load
In this process, data is pulled from its source and reformatted by the pipeline. Once the data is in the desired schema, we push it into the data warehouse.
ELT refers to:
Extract
Load
Transform
In this process, we simplify the data ingestion process by moving data without altering it. Later, once it is loaded in the data warehouse, we transform it into our desired format within the data warehouse.
ELT has become much more popular as cloud-based data warehouses like Snowflake and Databricks have made it easier to handle large transforms after data is loaded. This format is more flexible but can be more costly.
Putting it all together
Data is complex and often one of the areas product managers feel weakest. Understanding the building blocks of how data works will help you better frame questions and draw conclusions.
To become a data-informed PM, you’ll need to practice:
Self-serving queries from your operations and analytics databases
Using event data to understand user behavior
Joining product data to financial and operations data to draw conclusions on business impact
Building intuition for whether your data is correct or trustworthy
Anticipating push back on data and driving conversations forward
Supporting or disproving a hypothesis with data is one of the most impactful skills a PM can learn. But remember data is just one tool in your toolbox – it doesn’t replace product sense, talking to customers, or building your own intuition through domain knowledge.
Mixpanel answer key
In case you need help with any of mixpanel practice exercises, here’s the answer key:
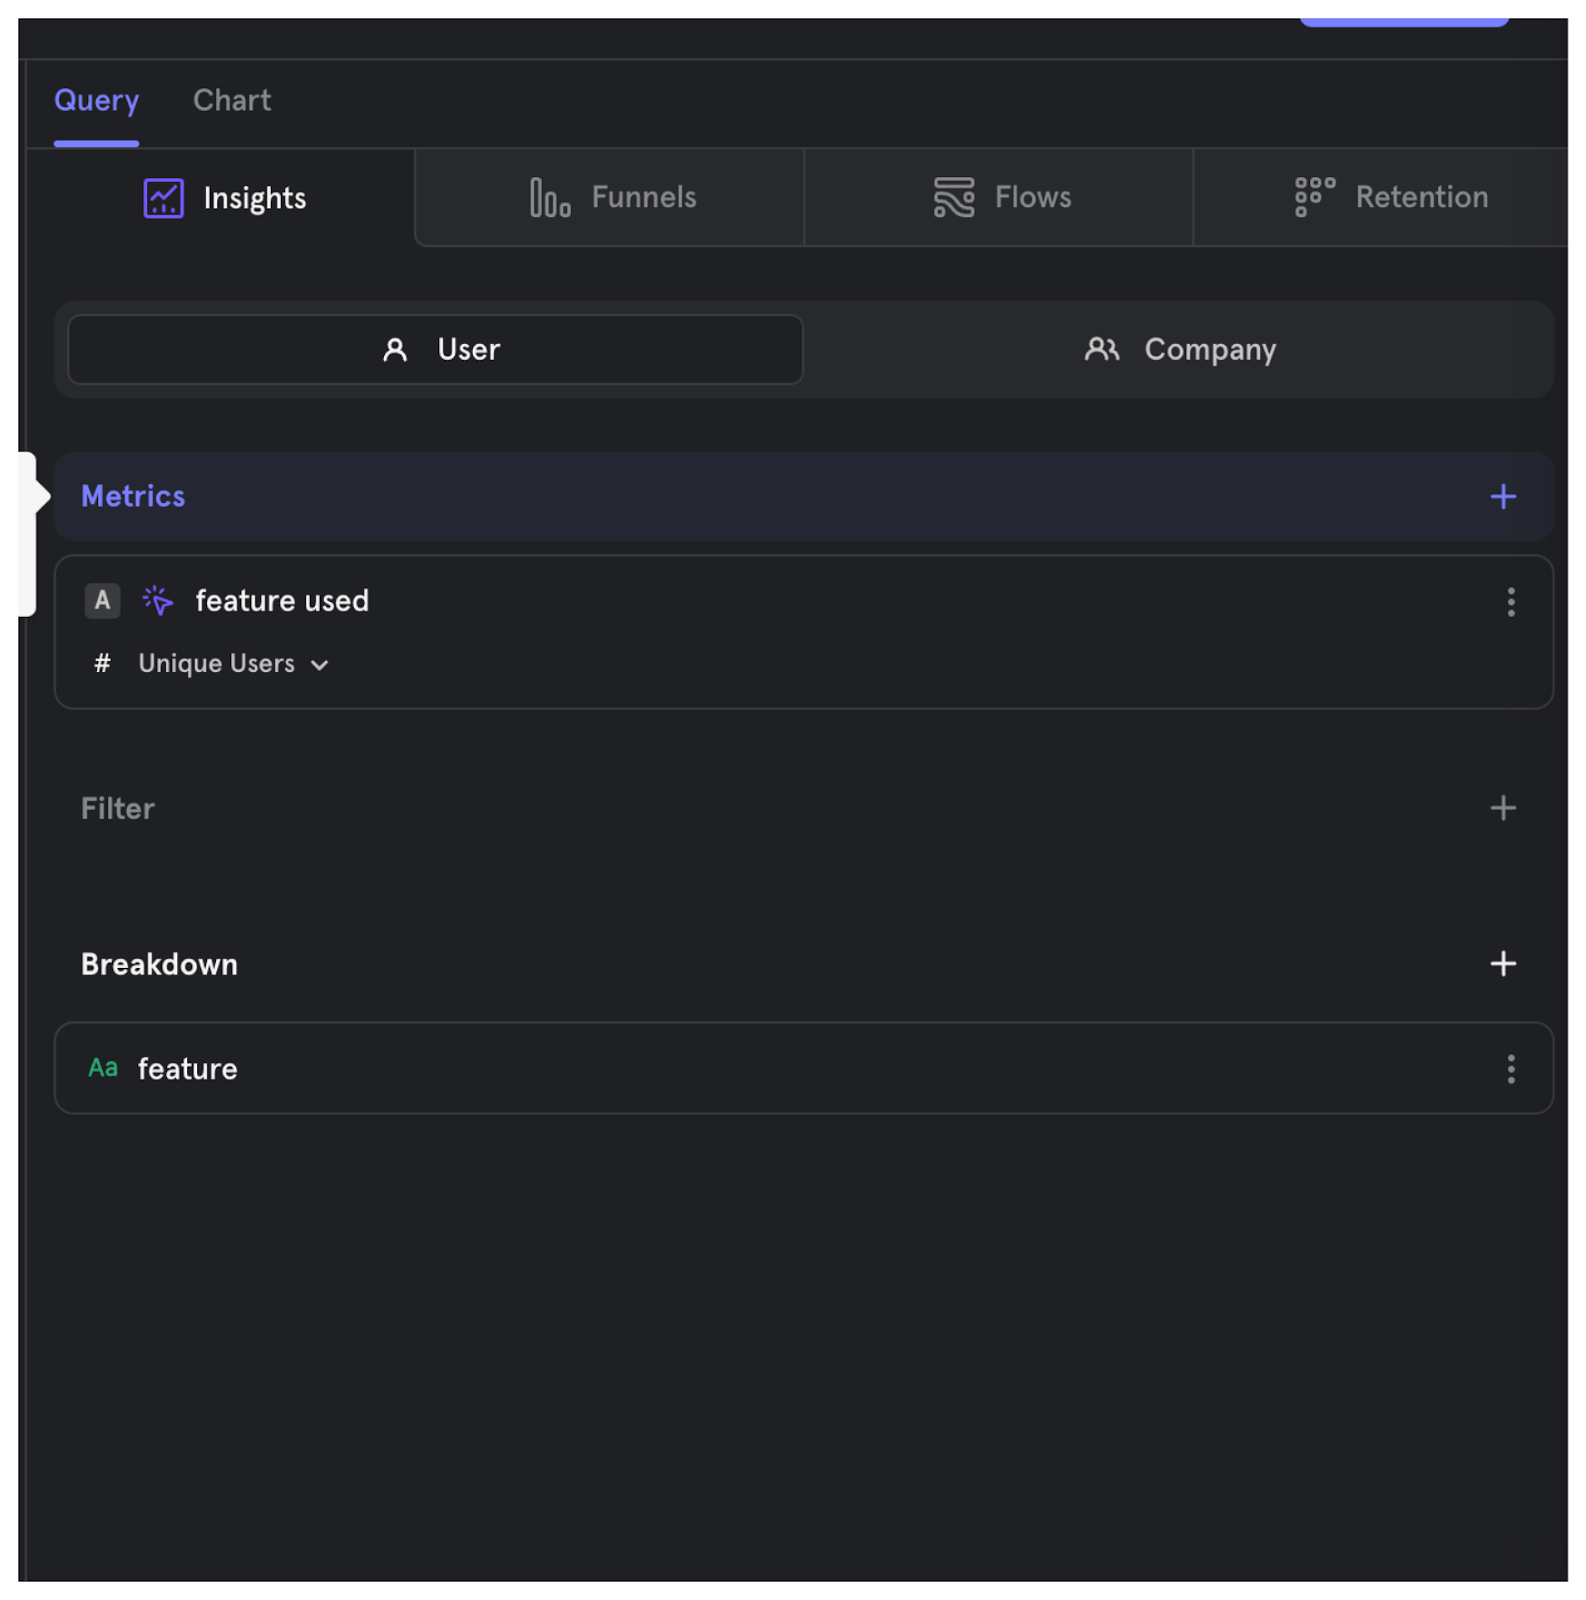
What are the top 3 features used by customers?
Query type → customer
Metrics → feature used
Breakdown → feature
Chart type → Bar

How has company MRR by plan changed over the past 3 months?
Query type → company
Metrics → All companies, sum of MRR
Breakdown → plan
Chart type → Column
Duration → 3 months

I saw your technical course for PMs. I’m a data PM and work primarily with databricks and alation. Will your course help me better understand data as a whole as well?
Would you say the distinction between event data and operational data is that:
- event data is any interaction within an experience (e.g., any steps they take in their journey to understand usage paths), and
- operational data is the end result we want to the customer to achieve (i.e. how many customers got to x point and we can use event data to help understand operational data?)
Appreciate the clarification!